
Insureds are increasingly turning to captives to address the medical stop loss (MSL) challenge. In this Thought Leadership article, authored by Nick Frongillo and Prabal Lakhanpal of Spring Consulting Group, An Alera Group Company, they highlight some of the underlying pricing and claims trends that need to be understood, and why this makes the captive route more appealing.
The medical stop-loss (MSL) market is experiencing significant upheaval as claim frequency and severity reach unprecedented levels. These developments have fundamentally altered the pricing landscape, with carriers adjusting their strategies in response to deteriorating loss ratios and mounting claim costs.
Rising Claims: Frequency and Severity
In 2025, in general claims exceeded target loss ratios. The surge in stop-loss claims reflects broader trends in the healthcare market. Three primary factors are driving this increase: rising costs per medical service, higher incidence rates of severe diagnoses, and the introduction of expensive new treatments, drugs, and therapies. While these developments were anticipated given long-term healthcare cost trends, the magnitude and pace of change have exceeded many projections.
Cancer remains the dominant driver of stop-loss claims across the market, leading in both claimant count and total claim dollars. Cardiovascular conditions typically rank second, while newborn complications have emerged as a significant contributor, particularly for claims exceeding $1 million. Although cell and gene therapies have not yet been major contributors to historical claims, they represent a growing risk.
The proliferation of these therapies is expected to further exacerbate both the frequency and severity of large claims in the coming years.
Reviewing data across our book of business and the broader industry reveals a significant acceleration in large-claim frequency across multiple threshold levels:
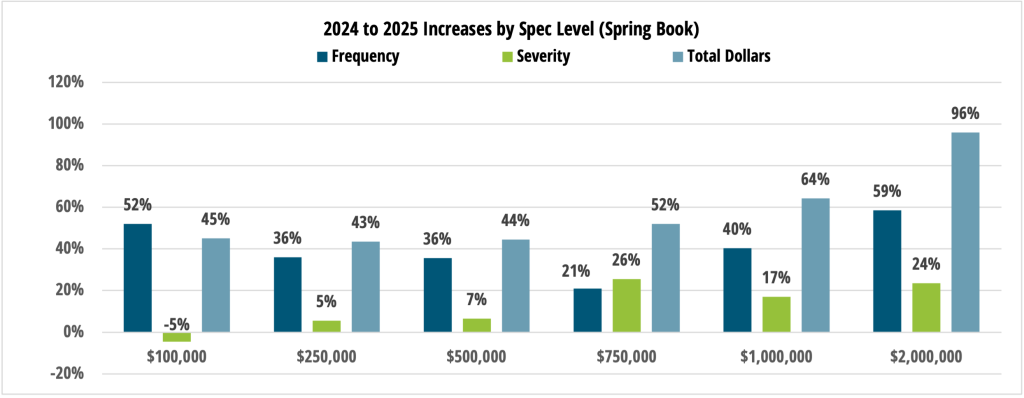
Claims exceeding $250,000 have grown substantially across the industry. Voya reported an 11% increase from 2023 to 20241. Spring’s internal data shows a more dramatic trajectory, with a 27% frequency increase from 2023 to 2024, followed by a 36% jump from 2024 to 2025 (a 72% cumulative increase from 2023 to 2025). In addition to increased frequency, severity rose by 21% on a per-claimant basis from 2023 to 2025, with total claim dollars for claims exceeding $250,000 increasing by 108% on a PEPM basis.
For claims above $500,000, the trend is equally concerning. TMHCC reported a 113% frequency increase from 2021 to 2024, including a 35% increase from 2023 to 2024 alone2. Internal data reflects a 95% increase in frequency from 2023 to 2025 (36% from 2024 to 2025), coupled with a 29% increase in per-claimant severity over the same period (7% from 2024 to 2025). As a result, total claim dollars exceeding $500,000 surged by 152% from 2023 to 2025 (44% from 2024 to 2025).
At the $750,000 threshold, Voya documented a 15% frequency increase from 2023 to 20241. Internal analysis shows a 21% frequency increase from 2024 to 2025, along with a 26% severity increase over the same period. Total claim dollars above $750,000 rose by 52% from 2024 to 2025. Comparing 2023 to 2025, frequency increased by 115%, per-claimant severity increased by 45%, and total claim dollars increased by 190%.
Million-dollar claims present perhaps the most striking picture. Sun Life reported a 61% increase in frequency from 2021 to 2024, including a 29% increase from 2023 to 2024. TMHCC reported a 113% frequency increase from 2021 to 2024, with a 35% rise from 2023 to 20242. QBE documented a 49% increase from 2021 to 2024 and a 32% increase from 2023 to 20244. From 2022 to 2025, Spring’s internal data shows a 131% increase in frequency. Total claim dollars exceeding $1 million have increased by over 200% from 2023 to 2025.
At the highest threshold of $2 million, TMHCC reported frequency increases of 105% from 2021 to 2024, 65% from 2022 to 2024, and 22% from 2023 to 20242. Internal data shows a 59% frequency increase from 2024 to 2025 and a 162% increase from 2022 to 2025. Total claim dollars on claims over $2M have increased 96% from 2024 to 2025.
Impact of Pharmacy Claims
Pharmacy claims have steadily increased as a percentage of total claims over the past several years, both for underlying medical claims and stop-loss claims. Across one client block, we have seen pharmacy’s share of claims for stop-loss claimants more than double from 2019 to 2025 (from under 15% of claims to 30%). This underscores the growing role of pharmacy costs not only in aggregate claim spend, but specifically among high-cost stop-loss claimants.
Carrier Loss Ratio Deterioration
The surge in claims has materially impacted carrier profitability. Many major carriers reported higher loss ratios in 2024 compared to 2023, including industry leaders such as Cigna and United5,6. Cigna explicitly identified stop-loss as the primary driver of its increased loss ratio, highlighting the outsized impact of this line of business6.
Market Hardening and Premium Increases
The combination of rising claims and deteriorating loss ratios has prompted a fundamental shift in carrier behavior. Double-digit premium increases have become commonplace and are directly attributable to the underlying claim trends. However, the current premium environment reflects more than actuarial updates to projected claims.
The market has entered a hardening phase as carriers shift their strategic focus from growth to profitability. This shift has reduced the competitive pressure that previously constrained premium increases. Carriers are demonstrating less willingness to aggressively price for new business, recognizing that underpricing in the current environment poses unacceptable financial risk.
In their 2025 survey, Aegis reported stop-loss premium increases of 9% to 11%, with long-term premium growth expected to range from 10% to 12%8. These figures likely understate future increases, as 2025 rates were developed using partial 2024 claims data. Continued deterioration in claim experience through 2025 is expected to drive further premium escalation in 2026 and 2027.
This dynamic has created a compounding effect on premiums. Rates are first increasing to reflect higher projected claims and then receiving additional upward pressure as carriers apply less aggressive pricing relative to those projections. The result is a premium environment shaped by both actuarial realities and a strategic recalibration of carrier risk appetite.
The Role of Captive Insurance Companies
Captive insurance companies help employers manage total cost of risk by retaining a portion of medical stop-loss risk in house, allowing organizations to capture risk margin that would otherwise go to the commercial carriers. This becomes increasingly valuable in a hardening market, where carriers embed greater margin into premium rates.
QBE reports increased interest in medical stop-loss captives and notes that captives have delivered great value to employers4. Stealth estimates that captives now represent 10% of the MSL market7. Across our own book of business, we have observed many clients achieve strong results through stop-loss captive structures. Captives structured appropriately – facilitate organizations in bending the healthcare cost curve in a sustainable manner – by creating more transparency, more proactive claims management, budget certainty and longer term pricing capabilities to counteract the volatility of the commercial markets.
Outlook
The convergence of accelerating claim frequency, rising severity, and market hardening suggests that the current premium environment is likely to persist in the near term. Absent a reversal in underlying healthcare cost trends or the introduction of effective cost-containment measures, employers and plan sponsors should expect continued upward pressure on stop-loss premiums.
The market appears to be in a transitional phase, with carriers recalibrating pricing models to reflect a new reality of elevated claim costs and reduced tolerance for underpricing risk.
References
1. Voya. Stop Loss Paid Claims Analysis 2025. Available at: https://www.voya.com/voya-insights/stop-loss-paid-claims-analysis-2025
2. TMHCC. 2025 Annual Report. Available at: https://www.tmhcc.com/en-us/-/media/project/tokio-marine/tmhcc-us/documents/2025-annual-report.pdf
3. Sun Life. Medical Stop Loss Market Report. Available at: https://sunlife.showpad.com/share/O4RCCHRh9ke9xod6BdbOz
4. QBE. 2025 Accident & Health Market Report. Available at: https://www.qbe.com/media/qbe/north-america/usa/files/accident-health/2025-ah-market-report.pdf
5. Becker’s Payer Issues. Payers Ranked by 2024 Medical Loss Ratios. Available at: https://www.beckerspayer.com/payer/payers-ranked-by-2024-medical-loss-ratios/
6. The Cigna Group. Fourth Quarter and Full Year 2024 Results. Available at: https://newsroom.thecignagroup.com/2025-01-30-The-Cigna-Group-Reports-Fourth-Quarter-and-Full-Year-2024-Results,-Establishes-2025-Outlook-and-Increases-Dividend
7. Stealth Partner Group (Amwins). State of the Market 2025. Available at: https://www.amwins.com/docs/default-source/external-linked-documents/stealth-docs/stealth_sotm_2025.pdf
8. Aegis. 2025 Medical Stop-Loss Premium Survey. Available at: https://www.aegisrisk.com/stop-loss-premium-survey