


You’re not new to the captive world. You’ve had your captive for several years and generally feel good about its performance. However, you’re now in one of the most difficult markets we’ve seen in a while.
Peaking in June of 2022 at 9.1%, the annual 2022 inflation rate leveled out at 6.5% at the close of the year. This is significantly higher than the average inflation rate for the last ten years (1.88%), as reported by Forbes.
COVID-19 (especially the stimulus packages), supply chain problems, widespread worker shortages, Russia’s invasion of Ukraine and resulting oil price surges, the housing market, and more predictable market cycles are some of the driving forces behind such high inflation.
Is the worst over? Possibly, but a recession is still a very real threat.
So, you feel good about your captive, but you look around and the market is hard, premiums are rising, capacity is inadequate, underwriting standards are rigid, an unstable economy is keeping many up at night, natural disasters seem par for the course, and the world is still picking up the pieces after a global pandemic.
Through all of these changes and more, it is critical that your captive adapts.
Instead of crossing your fingers that the status quo will pull you through, we recommend taking this opportunity to understand how to better align your captive with the market and/or rebuild an underperforming aspect of your current risk funding solution.
With organisations hyper focused on every dollar, this is a time to leave no stone unturned regarding maximizing the advantages offered by a captive. Enter, risk optimization.
Risk optimization is the process, related to a risk, of minimizing the negative and maximizing the positive consequences and their respective probabilities.
The idea is much easier to conceptualize with Spring’s graphical representation. The following chart illustrates an insured’s measure of variation in risk along the x-axis (coefficient of variation) and the measure of the insured’s expected retained profit along the y-axis.
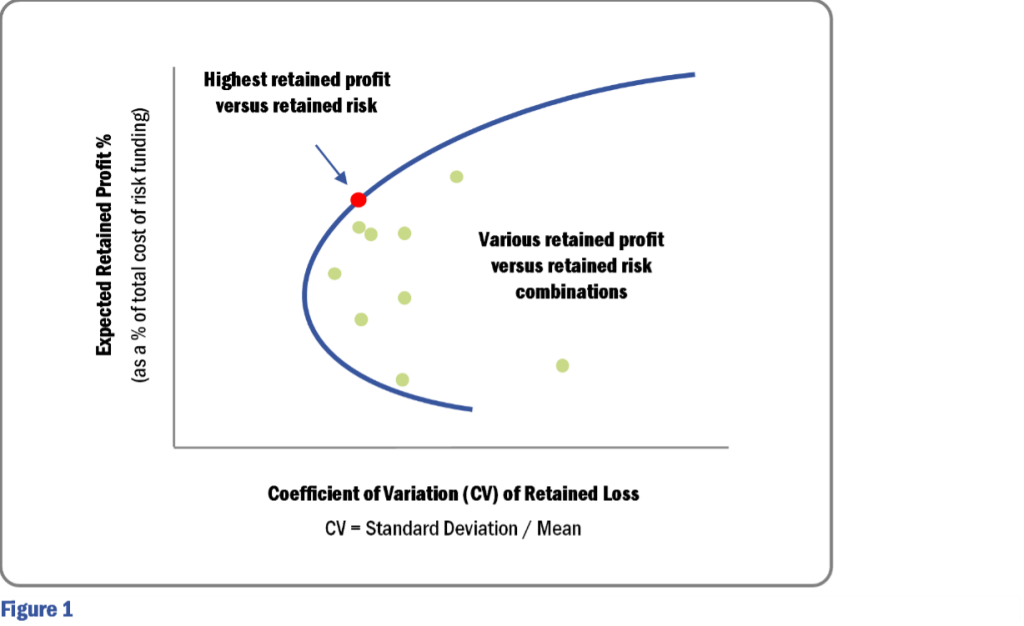
There is an optimal combination of retained risk that maximizes the ratio of profit to risk volatility (“PR Ratio” = “Profit to Risk Ratio”) for each insured within a captive programme.
This is represented by the red dot and is similar to the concept of modern portfolio theory, except we are looking at retained profits relative to retained insurable risks and are not focused on investment strategy.
The key takeaway is when it comes to an insured’s captive risk funding programme, there are various other reasons why optimizing your risks is important. These reasons include:
- Your aggregate risk profile hasn’t been examined from the ground up for several years (or longer) and things may have changed significantly
- A fresh set of eyes can objectively determine how to get the most out of your captive using captive risk optimization
- The opportunities for creating efficiencies in your risk funding solution only increase while going through hard market cycles like the one we are currently experiencing, where various casualty and property lines are seeing double digit rate increases on top of forced retention increases and reduced coverage limits/sub-limits from the commercial market
- Change implementation can be planned based on your priorities and strategic objectives
- Additional savings for risks or risk layers currently insured by the commercial market could be brought into your captive, leading to a decrease in volatility and an increase in savings
- We generally find that moving most risks/risk layers from the commercial market to a captive result in between 10% and 40% in long-term savings. These savings generally come from a combination of investment income on the captive’s invested assets, captive underwriting income and the lower operating costs of a captive (compared to commercial coverage)
- To demonstrate such savings, a large healthcare system client of ours with a captive insures a combination of P&C and benefits risks. In the last 10 years they have saved approximately 40% of guaranteed cost premium levels, or $100M. By recently adding medical stop-loss and coverages to their captive, they continue to create more savings while stabilizing results (i.e., reducing the CV illustrated in the chart above).
- Claims experience is better or worse than originally expected, therefore capital adequacy and pricing sufficiency should be reviewed
- Regulations may have changed, such as recent practices that have come out of captive court cases
Taking into account these various issues that drive the need for occasional but regular risk optimization studies, Spring has developed the following five-step process:
- Goals
- Impact
- Strategies
- Structure
- Measurement
Goals stage
In this initial stage, it is important to focus on confirming the goals and objectives of your captive, both new and old.
Have the older goals been achieved? How have they changed over the years? Will your current corporate strategy elicit the creation of new goals?
Also critical at this early point is the collection of data, and not only the stats and facts of the captive, but also the more subjective (qualitative) data that can be gleaned through management interviews and informal stakeholder surveys.
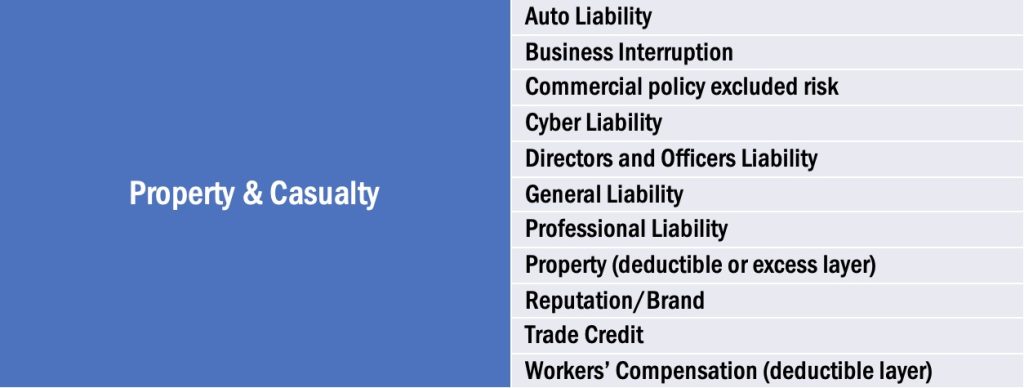
The goals stage highlights your current insurable risks and your means to fund that risk. Some of the most common P&C risks to insure in captives include, but are not limited to:
Strategies stage
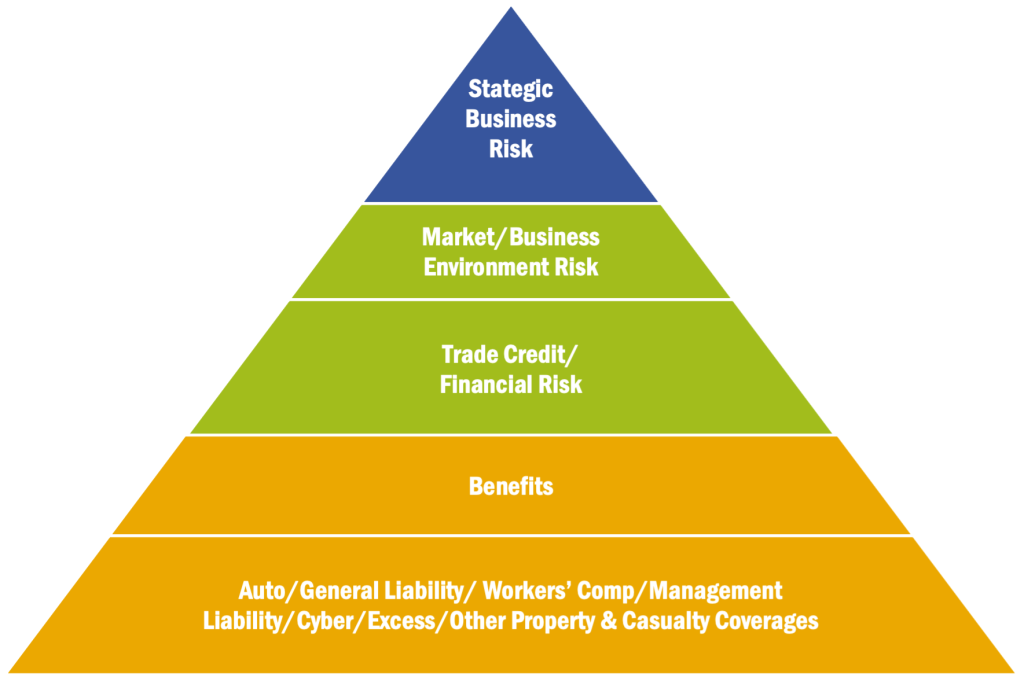
In this phase, a professional captive optimizer would first analyse any additional lines of coverage that could be insured by your captive. The key is to determine the possible return by line and then prioritize them.
The risk hierarchy exhibit below shows the typical order of prioritization, starting with the bottom layer and working up.
Secondly, a surplus management strategy would be developed. There are many considerations in appropriately managing the capital and surplus levels over the life of a captive, including average cost of capital, retention levels, reinsurance use, taxes and others that a team of actuaries and consultants would review and develop strategies to address.
Structure stage
Now that you know what you want to do and how, it’s time to take a closer look at how it will all work together in a logical structure.
Economic trends and market changes should give you some food for thought. For example, pure captives are increasingly changing to sponsored entities.
It is important to identify investment management best practices as well as the optimal collateral structure.
Impact stage
The Impact Stage of a Risk Optimization Study involves looking at all the different pieces of the captive puzzle to determine how they would be affected by the changes you’re considering.
A few activities here would include:
- Conduct the analysis of your risk financing optimization
- Includes quantification of benefit/cost over lifetime including cost of capital
- Allows for a better understanding of the optimal PR Ratio considering the insured’s P&C and benefits risk tolerance
- Cost of capital and risk premium loads can be minimized
- Appropriate modeling of correlation between risks is instrumental to this process
- Review your current reinsurance levels and optimize your use of reinsurance
- Stress test the captive with reasonable adverse case outcomes
Measurement stage
Finally, all sound captive projects end with measurement. This is the time to determine to what extent goals were met and impacts made.
A great deal of this stage relies on the creation of solid industry benchmarks against which to measure current and future captive performance. It is also important to develop implementation plans based on what you uncover.
At the conclusion of the measurement phase, Spring would produce a risk optimization study report detailing all the findings of the risk optimization study that are outlined and reviewed along with the recommendations developed in this last phase.
These findings can serve as a baseline for measurement going forward.
Regardless of how old or new your captive is, there are bound to be numerous internal and external factors that have changed since it was created.
In 2023, the market is a bumpy ride, making it a great time to have a professional not only take a snapshot of how your captive is currently performing, but also help you project and strategize as to where your captive should be in the future.