
Captive Intelligence reported last month that Texas had licensed three new captives in three days, its first additions of 2026. In and of itself, this was not small news – one of the world’s fastest growing captive domiciles continuing to build momentum.
But it was significant for another reason – those additions lifted Texas to exactly 100 active captives, making it the 14th domicile tracked by DataHub with triple figures and the newest member of Captive Intelligence’s DataHub 100 Club.
Membership criteria
What is the DataHub 100 Club? A new grouping of the industry’s largest domiciles. There are two key criteria for admittance to the DataHub 100 Club, both somewhat self-explanatory, both with caveats:
Firstly, a domicile must feature on Captive Intelligence’s captive database DataHub. As of February 2026, there were 56 domiciles on DataHub (now housing nearly 6,000 captives).
The most notable exception is South Carolina, where information on individual captives is less readily available than in other large domiciles. South Carolina is not – yet – on DataHub. All other prominent domiciles are.
Secondly, a domicile must have 100 active captives tracked by DataHub. This excludes individual cells, such as protected cells or series business units, but includes cell companies (aka the cell core or sponsored captive) and all other types of captive.
Georgia, for example, is not in the 100 Club, despite having more than 100 active ‘risk-bearing entities’, because it would need to include its individual cells to meet the threshold.
The chart below ranks the 14 members of the DataHub 100 Club by active captive licenses tracked by DataHub at the end of January.
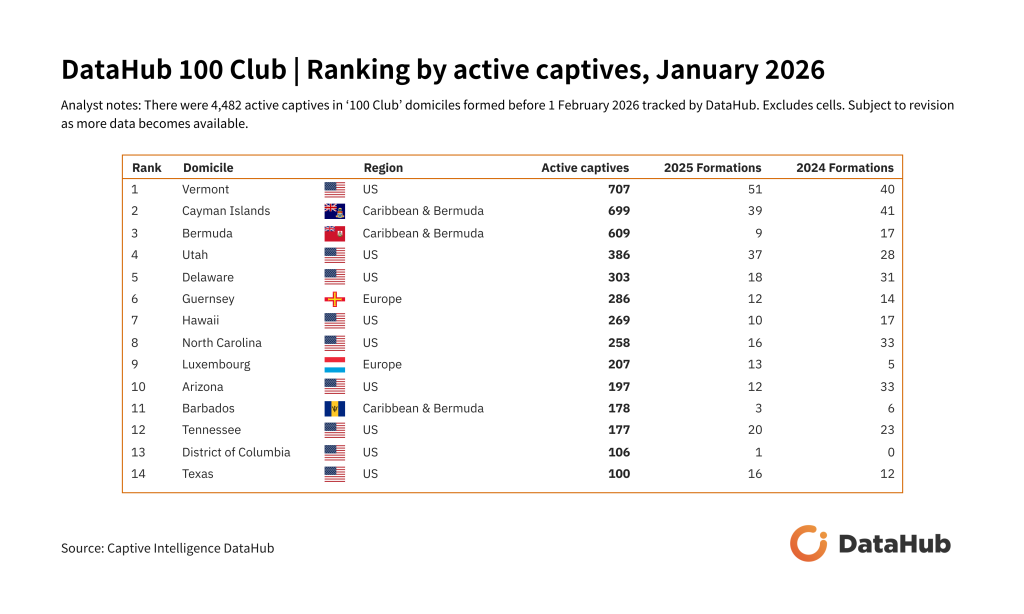
Texas, then, is a fitting addition. In a list already dominated by US domiciles, Texas is the country’s ninth club member. Of the remaining five members, three are three in the Caribbean and Bermuda (Cayman Islands, Bermuda, and Barbados) and two are in Europe (Guernsey and Luxembourg). A roughly 65/20/15 split.
Size matters
The industry’s two largest domiciles also produced 2025’s largest number of captive formations (excluding cells) – Vermont added 51, Cayman added 39 – with the fourth largest, Utah, third. Clearly, industry health and direction continue to be led from the front.
Even so, size is no guarantee of momentum. The chart below, based on DataHub data, again ranks the 100 Club by total active licenses but instead visualises their formations over the last five calendar years, helping to surface signs of growth and fade.
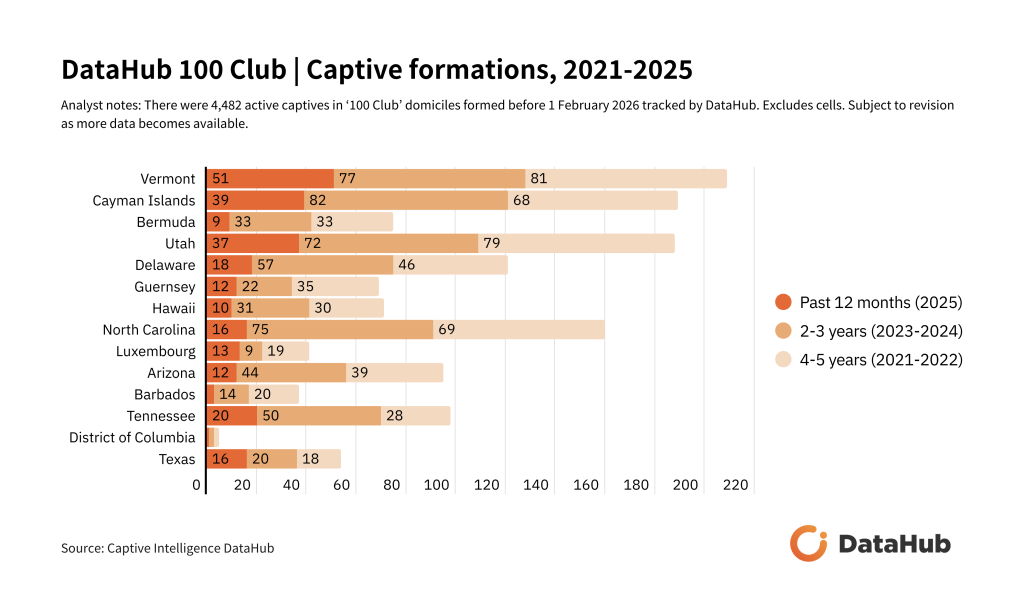
Yes, only three club members produced less than ten formations in 2025, but the recent numbers for the likes of Bermuda and Barbados appear not only low relative to their peers but slowing, while the numbers for District of Columbia have all but stagnated.
Bermuda’s apparent deceleration, from an average of over 15 formations per year across 2021-2024 to nine in 2025, is particularly notable as a top three – and former industry-leading – domicile.
Other top ten placers by active licenses, such as North Carolina and Arizona, also saw their recent average annual formation count roughly half last year.
Net change in 2025
Looking beyond formations to net change, the below chart shows the difference between a 100 Club member’s active captive licenses (excluding cells) tracked by DataHub at year-end 2025 and year-end 2024.
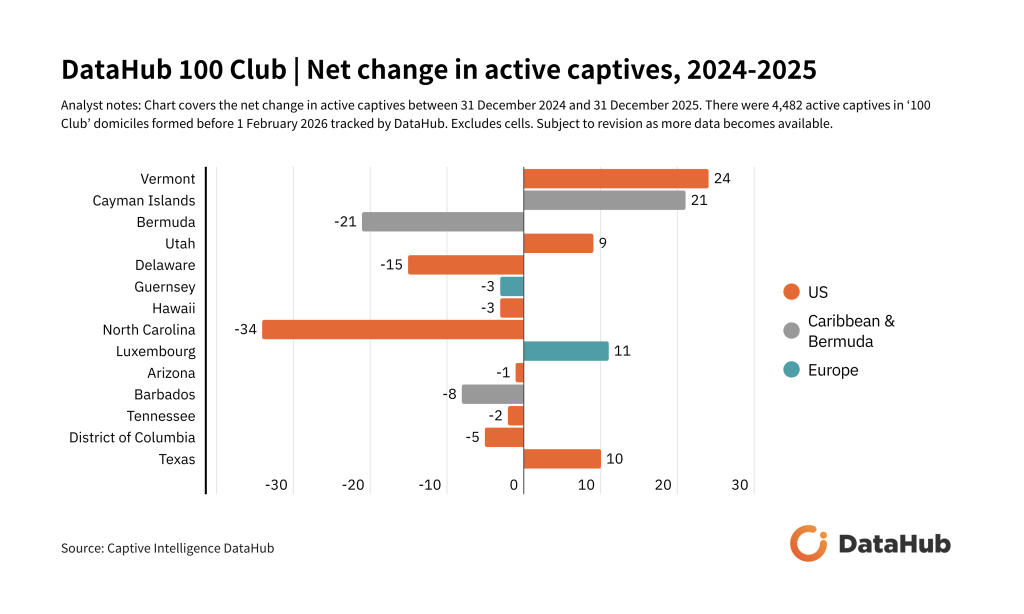
North Carolina has the standout data point here on -34, though its net decline is largely due to the actions of CIC Services, who, as part of an undertaking largely spanning Q4 2025, redomiciled a host of captives from the Tar Heel State (and a few from other domiciles) to Utah and converted them to cells. Without this undertaking, North Carolina’s 12-month net change would be closer to flat.
Other domiciles with notable net declines include – again – Bermuda and Barbados, but also Delaware. Another net decline for District of Columbia in 2026 could result in a first exit from the 100 Club, its active license count having fallen last year from 111 to 106.
At the other end of the spectrum, Vermont and Cayman appear in particularly rude health, their industry high formations outpacing surrendered licenses by considerable margins, giving them 12-month net gains of 24 and 21 respectively.
Elsewhere, there were significant 12-month net gains for Utah (9), Luxembourg (11), and Texas (10) – the latter’s showing again notable for its relatively lowly position on the list.
In fact, the rise of Texas is even more impressive on a five-year basis. Using provisional regulatory numbers seen by Captive Intelligence, Texas has a five-year active growth rate in active captive licenses (excluding cells) of nearly 70% – the largest among 100 Club members. Arizona and Tennessee follow on roughly 50% and 20% respectively.
And in further evidence of the wider momentum enjoyed by the US captive market generally, the top six by five-year net change are all US domiciles (and provisional numbers from the South Carolina insurance regulator suggest a top seven).
The makeup of 100 Club markets
But how does the 100 Club as a group compare to the rest of the captive insurance industry? The chart below shows the breakdown by captive manager of all 100 Club captives with a known manager tracked by DataHub versus all other captives with a known manager (excluding cells).
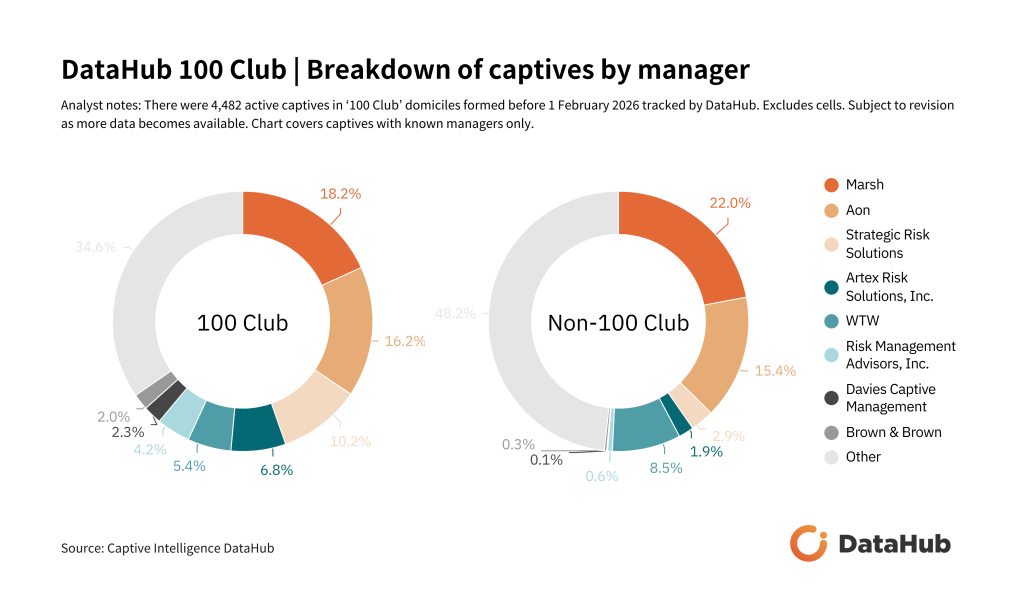
A few points of note. Firstly, the chart highlights the global reach of Marsh and Aon. These managers not only have the largest shares of management business among 100 Club captives and non-100 Club captives, but their market shares among both groups are comparable across the two groupings (18% and 16% respectively versus 22% and 15% respectively).
Secondly, it highlights some managers whose business models appear driven by an interest in the largest domiciles. In contrast to Marsh and Aon, Strategic Risk Solutions and Artex (ranked third and fourth globally) have notably higher proportions of 100 Club business than non-100 Club business (10% and 7% respectively versus 3% and 2% respectively).
Finally, the top eight managers among 100 Club managers have a greater combined market share of 100 Club business (65%) than they do non-100 Club business (52%), highlighting the challenge many smaller managers face winning top-end business.
Parent company variations
The chart below does for parent sector as the previous chart does for captive manager. This time, when again comparing 100 Club captives as a group to the rest of the industry, we see more variation at the top of market. Whereas the dominant managers have comparable visibility at the top of both groupings, the industry’s dominant sectors are much more visible among 100 Club captives than they are among non-100 Club captives.
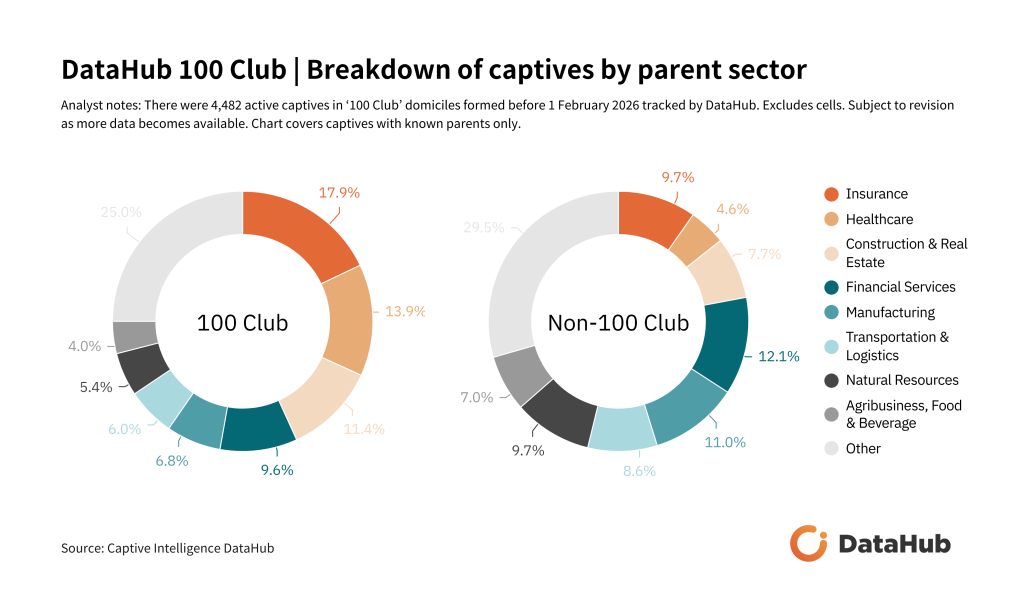
The top three sectors: Insurance accounts for 18% of 100 Club captives versus 10% of non-100 Club captives, Healthcare accounts for 14% of 100 Club captives versus 5% of non-100 Club captives, and Real Estate accounts for 11% of 100 Club captives versus 8% of non-100 Club captives. Combined, the top three account for 43% of 100 Club captives versus 22% of non-100 Club captives (the historic dominance of Cayman in the captive healthcare market plays a significant role in this outcome).
By comparison, the next five most prevalent sectors among 100 Club captives – Financial Services (excluding insurance), Manufacturing, Transportation & Logistics, Natural Resources, and Agribusiness, Food & Beverage – are all better represented by non-100 Club captives.
Quantity and variety
Back to the clubhouse. Of course, like smaller domiciles, the captive industry’s largest domiciles cater to a wide range of companies, a truism visualised by our final chart showing the proportion of a 100 Club member’s captives owned by a public company (and the proportion of those public companies also featured on a key index, such as the S&P 500 i.e. blue-chip companies).
According to DataHub, among 100 Club domiciles, Luxembourg has the highest proportion of captives owned by public companies (60%) followed Bermuda (48%) and Texas (44%).
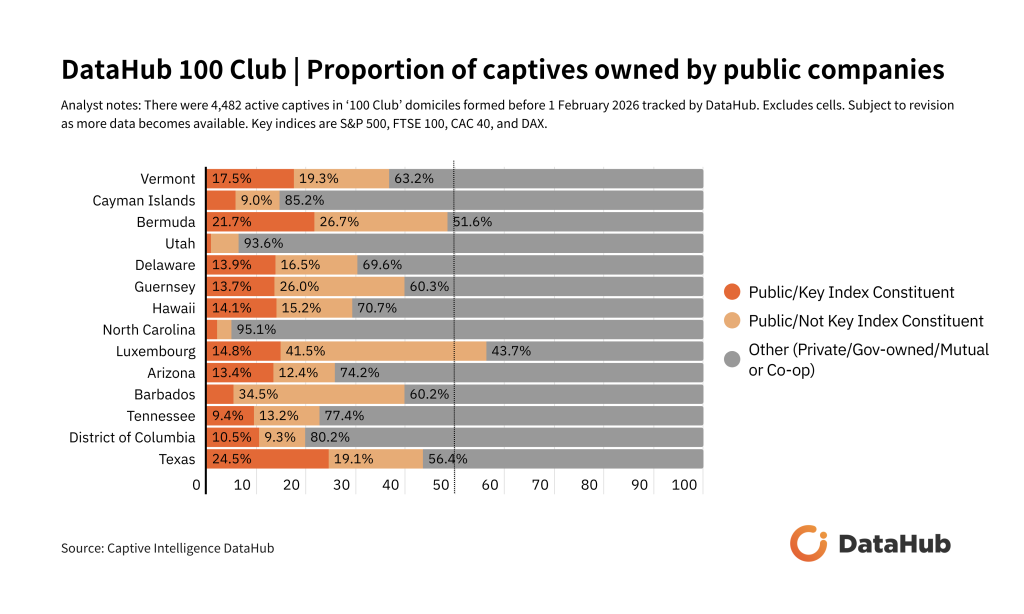
Texas, though, is again notable for having the highest proportion of captives owned by blue-chip companies (25%) – at least in part the result of its well-documented drive to re-domesticate overseas captives owned by large local businesses.
Bermuda’s high blue-chip score (22%) suggests it remains a popular offshore destination for large corporates with global businesses managing complex risks (though it is also worth noting that due to there being less information available about captive owners in offshore domiciles than in onshore domiciles DataHub usually has a lower proportion of known parents for offshore captives and because more information is available on public companies, the ‘public proportions’ for some offshore domiciles in this chart will be skewed. This extends to Delaware).
The chart also highlights those 100 Club domiciles building their industries on business from smaller, private captive owners – most notably North Carolina and Utah, where the proportion of captives owned by private companies is 95% and 94% respectively.
A reminder, then, that even the market spanning the top of the domicile ranking caters to a wide variety of business owners. And that the preservation of this variety is important to the long-term future of the global captive industry.
Look out for more news and analysis on DataHub 100 Club domiciles from Captive Intelligence in the coming weeks.